Statistics Norway mathematics
Statistics Norway mathematics
Norway is growing, but the growth is very unevenly distributed – says Statistics Norway. Is your municipality experiencing population growth? With Statistics Norway-Mathematics Kunnskap.no , students can now reason and argue with up-to-date data about their own local community from Statistics Norway (SSB).
Kunnskap.no is introducing new additional modules for Mathematics 8-10. There, students can use current data from Statistics Norway and find the population growth in their own municipality and compare it with another municipality. The students' assignment is, for example, to calculate and compare:
• What is the population growth rate in your municipality?
• What is the population growth rate in a neighboring municipality?
• How is the growth in relation to your municipality?
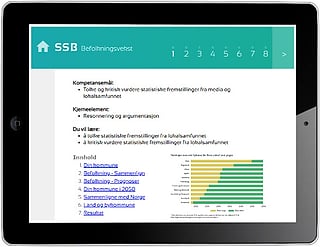
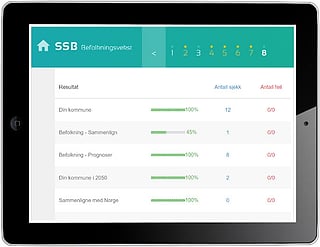
The students' answers are compared with real data. This inspires the students and they understand that mathematics concerns them. The students are also invited to look into the future. Based on Statistics Norway's forecasts, they can see and explore which factors are most important for the population weight in the municipality. Is there an increase in the number of births, is there immigration or are there other local factors.
Math teacher Tormod Briså has several years of experience as a math teacher at Bærumsskolen. He believes that the Statistics Norway resource both makes math more relevant for the students and increases the individual's sense of achievement.
"The practical approaches in the tasks provide an easy entry so that everyone will achieve something and experience mastery. Nevertheless, the tasks themselves are differentiating because reflection questions and your own choices along the way allow for different levels of difficulty," says Tormod.
The math teacher also believes that the tasks with real-time data contribute to increased motivation and learning enjoyment. “Such tasks contribute to this because they are interesting for the students and cool to create. It gives a bit of a wow effect,” says Briså. Other schools that have tried it also say: “The students like this approach! It makes the tasks even more relevant and recognizable for the students.”
We also believe that students will be taken more seriously if they have to deal with reality when exploring mathematics.
If you want to use the Statistics Norway resource yourself, you can get access by ordering Mathematics 8-10 from Kunnskap.no . If you are already a user of Mathematics 8-10, you can be happy that the Statistics Norway content will soon be integrated into this. For more information, you can contact Kunnskap.no by email: kunnskap@kunnskap.no