Learning analysis and usage-based data – more than just a form of payment
Usage-based data was introduced in the Oslo AVT project as a new and modern payment method with the aim of giving greater freedom of choice for the individual teacher. It was also introduced as a payment method so that schools pay according to how much they use a teaching resource.
Learning materials that offer usage-based data track what students do and therefore have many values beyond being a payment solution. They have value for the individual student because it means independence and mastery, they have value for the teacher because he/she gets a tool to analyze how the teaching works both over time and for the individual student, and it gives the school owner an overview of how the school is meeting the goals in the curriculum.
For the student, application-based data means mastery
A student who uses application-based learning materials will receive immediate feedback throughout their learning. The student can then explore new topics by listening and watching and then try to solve tasks that are closely related to the new topic the student is exploring.
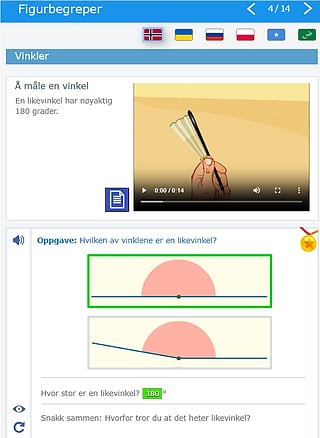
The student will learn about angles and watch a video where a fan makes an angle concrete. The student can listen and watch as many times as he/she wants. The text in the video is also supported in its own text fields.
In the task that supports the exploration and that follows immediately after, the student must find out for themselves – as here – what an equal angle looks like:
If he/she didn't understand it, it would look like this:
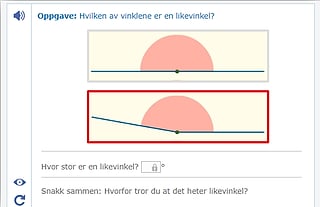
With a good learning strategy, the student will repeat the video and then gain insight into what an equal angle is.
Then the student - through their own exploration and without having to raise their hand and ask for help - has understood what an equilateral triangle is. This gives the student a sense of mastery and faith in their own abilities.
Application-based learning tools have many forms of rewards
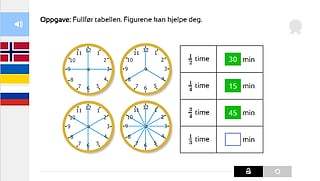
To support concentration over a longer period of time than just solving a single task, it is also required that all tasks be solved correctly.
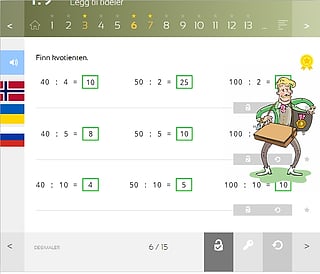
Here we are on page 7 and have learned a lot about "adding tenths". If the student manages to keep a cool head and calculate calmly through all the tasks, a special reward awaits. Such a reward can be so stimulating that tasks are deleted and redone. An animation appears and does something funny.
Medals for total effort
Under the competency objective " explore the properties of different polygons and explain the concepts of shape similarity and congruence ", students will gradually build up their competency - gold awaits when 80% is solved, silver when 60% is solved and bronze when 30% is solved correctly.
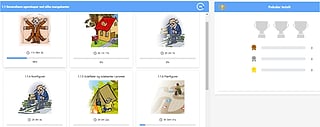
Teachers save work by sharpening and correcting – and can instead concentrate on ensuring that all competency goals are achieved for the class as a whole and the individual student.
Teachers can take out class reports, for example, based on competency goals in mathematics and science. For the competency goals (on the left), scores and time are displayed. For students, scores, number of check answers, number of errors at the end and total number of errors are displayed. The layout is optional for the teacher.
Access to data is granted based on roles defined through Feide . A teacher only has access to data about the students he/she has in the subject and the student only to himself/herself.
The graph shows scores over time.
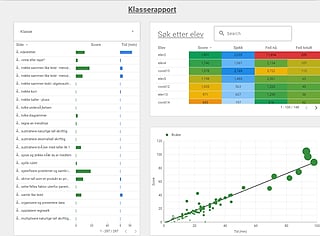
Accumulated data over a period of time shows periodic goal achievement
The analyses below show the results of content accumulated per student and over a certain period of time. Classes and students and periods can be freely selected by the teacher.
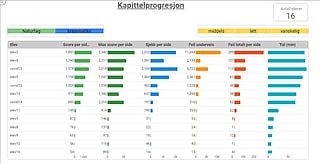
Objectives by knowledge area, competency objective, core element, basic skills are shown together as below. The teacher can choose which ones by selecting one or more.
Granular measurements through the Fagkartet improve the possibilities for individual adaptation
Mathematics 1-10 is tagged in its entirety for each page against the Subject Map. By selecting smaller areas in the subject map, the teacher can more easily find out what the individual student is struggling with and thus better prepare for the individual student.
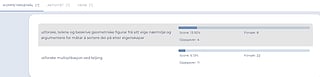
Analyzes over time show learning strategies
The time analyses show errors, scores and checks – i.e. parameters that tell about the student's learning strategies – over time and accumulated over which compensation goals and core elements the students have worked on. This says something about the work methodology and learning strategies. The analyses can be carried out both for the individual student and for a group of students.
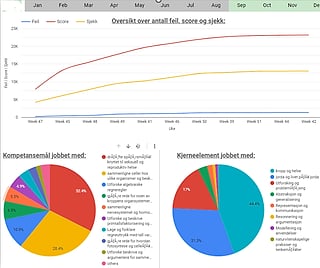
School leaders want to know whether curriculum goals have been achieved and what the implementation costs
A school principal is concerned that the school implements teaching in line with the curriculum. The school principal can then provide overviews of subjects and competency objectives.
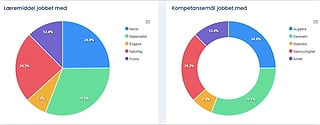
School leaders can also get overviews and aggregated data on academic work over a period of time:
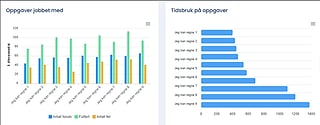
The ongoing costs for use are also available on a monthly basis:
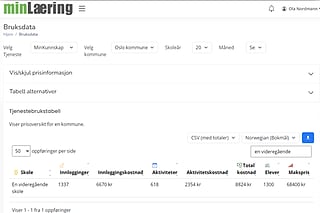
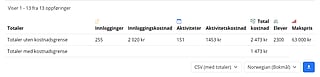
In this way, the school principal will be kept informed both in terms of academic goals and finances.
School owners get an overview of which schools are active and what the usage costs
On an ongoing basis and for each month, the school owner can get an overview of incurred costs.
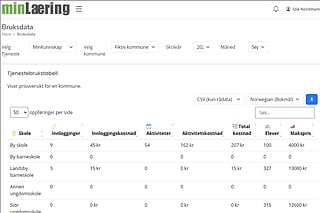
With learning analysis and usage-based data, it is possible to organize teaching in a good way for both the class as a whole and the individual student. The school principal will always be able to show which curriculum objectives the school covers. Both the school owner and the school principal will have financial control over the costs and will not pay for more than what is used.
The publisher will continuously focus on demonstrating good use of the content.
Telling about good use of content is every publisher's dream. Digital learning materials are developed over time and based on ongoing feedback from users. Being allowed to tell stories – preferably about the small details – is much more interesting than just talking prices with potential customers.

The payment method itself
Today, there is a recurring payment once per month based on the number of logins and the use of the learning resource such as the number of pages that have been used. School owners, school principals, teachers and students can check their own ongoing usage and costs through the Feidetjenesten minLæring.
The maximum price set based on the number of students the school will provide is the upper limit for the costs on a monthly basis. This is to give the school control over the costs.
Payment is based on the number of logins to the Feidetjenesten where the learning materials are located. This data is open to the school owner. Overviews of how many websites or pages in the learning material have been used are reported from the publisher to the school owner, school principal, teacher and student through the Feidetjenesten minLæring.
Although the AVT project started in 2017, the ongoing pay-as-you-go service did not start until several years later, around 2022/2023.
Knowing how to set prices was new to many, so it was decided that publishers could adjust prices quarterly.
Content allocation
If a municipality enters into an agreement on behalf of all schools, the service can be opted out of by those who do not wish to use the service. This can be either at the time of award or later.
All content that a municipality enters into an agreement on is distributed to the entire school. The school is free to opt out or not opt out as needed. In any case, it is only the usage that a school pays for.
Usage-based data will be available for more municipalities and schools
CyberBook has now been delivering usage-based paid services to the Norwegian Education Agency in Oslo for over a year. The national pilot project under the auspices of the Norwegian Ministry of Education for the "Usage-based payment model for teaching materials" opened in the spring of 2024 for an additional 5 municipalities. More are expected to follow.
The feedback from the projects is positive. The service will therefore probably be available to all municipalities from the turn of the year 2024/2025.
The service is expandable to multiple publishers via the Feidetjenesten minLæring.